1. Install and activate
What you need
- SketchUp 2019 or newer on Windows.
- An internet connection when you run a simulation. TrueSouth downloads weather data and checks your license about once a week.
- Your license key, from the purchase email or your purchase page.
Install the extension
- Download the
.rbzfile from your purchase page. Don't unzip it. - In SketchUp, open Extensions › Extension Manager and click Install Extension.
- Choose the downloaded file and confirm, then restart SketchUp.
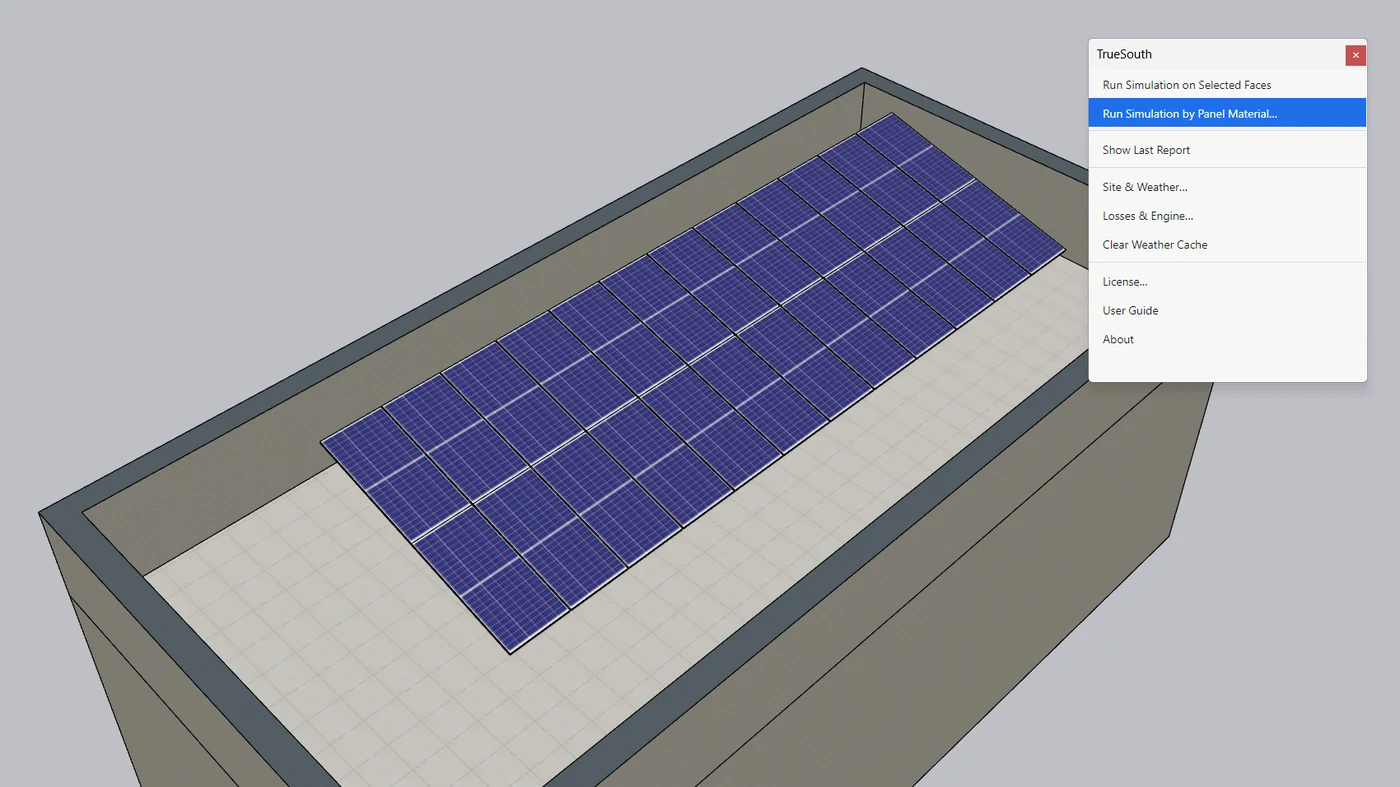
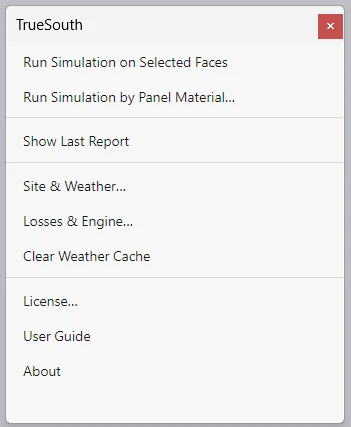
TrueSouth appears under Extensions › TrueSouth. There is also a TrueSouth toolbar button, which opens the same menu. If the button is missing, turn it on under View › Toolbars › TrueSouth.
Activate your license
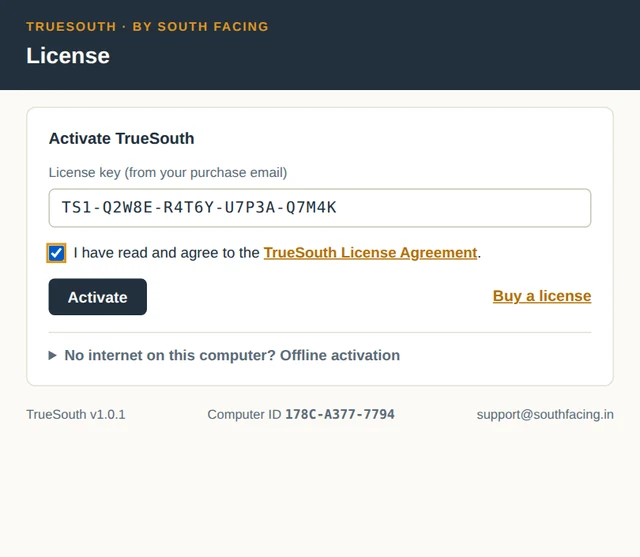
- Open TrueSouth › License….
- Paste your key. It looks like
TS1-XXXXX-XXXXX-XXXXX-XXXXX. - Tick the License Agreement box and click Activate.
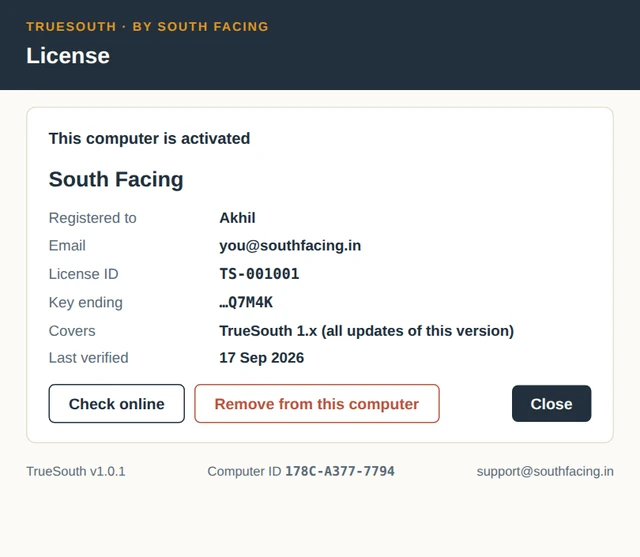
When activation succeeds, the window shows your company name, license ID and version coverage. Your company name is also printed on every report.
If you open a simulation before activating, the License window opens by itself. After you activate, the simulation continues automatically.
No internet on the design computer?
Use offline activation in the same window:
- Enter your key and tick the agreement.
- Click "generate a request code", then Copy code.
- Email the code to support@southfacing.in from your purchase address. We reply with an activation token.
- Paste the token into "Paste the token here" and click Apply token.
Good to know: the token is a long text that starts with eyJ. If you paste something else, such as the request code or your license key, the window tells you what it is.
Moving to another computer
Each license works on one computer at a time. To move TrueSouth to a new computer:
- On the old computer, open License… and click Remove from this computer.
- Activate on the new computer.
You can move the license up to 4 times a year yourself. If a computer broke and you can't remove the license from it, email us and we'll free the seat.
Keep your key private. It is tied to your company name, and every report shows who the license belongs to.
2. Prepare your model
TrueSouth works with the model you already have. It traces sun rays from each panel through your geometry, so anything modelled can cast a shadow. Five things make the results reliable.
Set the location
Open Window › Model Info › Geo-location. Then either click Add Location and find the site, or use Set Manual Location and type the coordinates.
TrueSouth reads the latitude, longitude and time zone from the model. The report header shows which location was used.
Tip: you can also type coordinates in Site & Weather. Model coordinates are then ignored.
Point north the right way
TrueSouth uses the model's north direction. If your drawing isn't aligned with north along the green axis, set the true direction with SketchUp's Solar North toolbar (View › Toolbars › Solar North).
A wrong north direction changes the panel azimuth and every shadow.
Model each panel as a face
- Draw one flat face per module, or per group of modules you want to report separately. Faces can sit inside groups and components.
- Use the real module outline and tilt. TrueSouth takes each face's tilt and orientation straight from the geometry.
- Faces are assumed to face the sky, so reversed faces are handled for you.
- Faces smaller than 0.05 m² are ignored.
Paint all panel faces with one material
This is the easiest way to run a simulation. Give every panel face the same material, such as your module texture, and use that material only for panels. TrueSouth then finds every panel in the model, including those inside groups and components.
Model what casts shade
Include anything that can shade the array:
- parapets and walls;
- water tanks, lift rooms and staircases;
- neighbouring buildings;
- trees;
- other rows of panels.
Simple solid shapes are enough.
Hidden objects don't cast shade. Anything hidden, including objects on hidden tags, is ignored. Show everything that should cast shade before you run.
3. Settings
Settings are saved on your computer and apply to every model until you change them. The report lists the values used.
Site & Weather
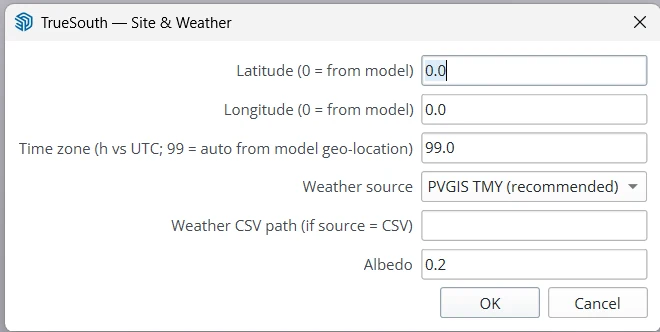
| Setting | What it does | Default |
|---|---|---|
| Latitude, Longitude | Leave at 0 to use the model's geo-location. Enter values to override it. | 0, 0 |
| Time zone | Hours from UTC; this only affects the hour labels in the shading chart. At 99 it is taken from the model's geo-location. If you typed coordinates yourself, enter 5.5 for India. | 99 |
| Weather source | PVGIS TMY is a typical year from satellite data, and is recommended. NASA POWER is the 2023 calendar year, used automatically if PVGIS can't be reached. CSV is your own file. | PVGIS |
| Weather CSV path | Only for the CSV source. The file needs a header row month,day,hour,ghi,dni,dhi,temp,wind and 8,760 rows, with hours in UTC, irradiance in W/m², temperature in °C and wind in m/s. | (empty) |
| Albedo | Share of sunlight reflected by the ground or roof. Use 0.2 for typical surfaces and 0.3–0.5 for white roofs. | 0.2 |
Weather data is downloaded once per location and saved. Clear Weather Cache forces a fresh download.
Losses & Engine
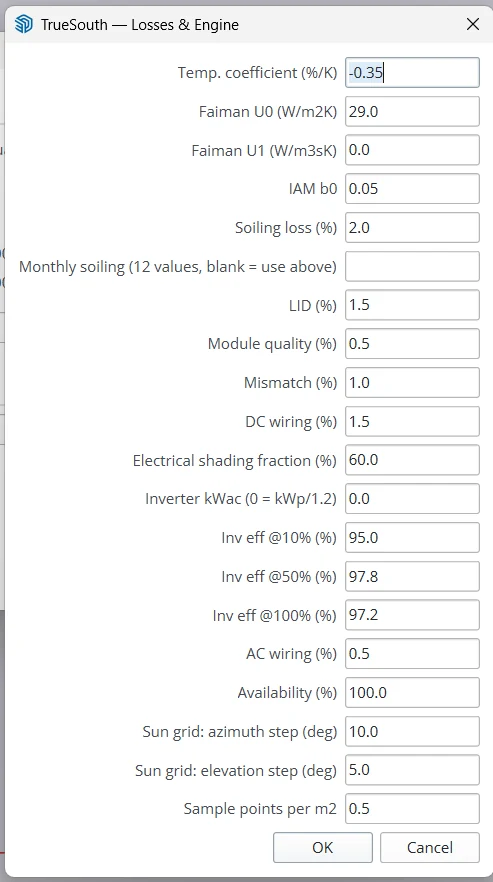
| Setting | What it does | Default |
|---|---|---|
| Temp. coefficient | Power temperature coefficient (Pmax) from the module datasheet. | -0.35 %/K |
| Faiman U0, U1 | How well the modules are cooled. Use 29 / 0 for open mounting, about 20 / 0 on a roof with an air gap, and about 15 / 0 for flush or insulated mounting. | 29, 0 |
| IAM b0 | Reflection loss at low sun angles (ASHRAE model). 0.05 suits standard glass. | 0.05 |
| Soiling loss | Dust and dirt on the modules. | 2 % |
| Monthly soiling | Optional: 12 comma-separated values, January to December, for example 3,3,4,4,5,2,1,1,2,3,3,3. Replaces the single soiling value. | (empty) |
| LID | Light-induced degradation in the first months, from the module maker. | 1.5 % |
| Module quality | Difference between rated and real module power. Use a negative value for a positive power tolerance. | 0.5 % |
| Mismatch | Small differences between modules in a string. | 1 % |
| DC wiring | Cable losses on the DC side at full power. | 1.5 % |
| Electrical shading fraction | How much a shaded cell also pulls down the rest of its string. Around 60 % suits string inverters; use a lower value, such as 20–30 %, with optimisers or microinverters. | 60 % |
| Inverter kWac | Total inverter AC rating. At 0 it is set to plant kWp ÷ 1.2. | 0 |
| Inv eff @10 / 50 / 100 % | Inverter efficiency at three load levels, from the datasheet. | 95 / 97.8 / 97.2 |
| AC wiring | Cable losses on the AC side. | 0.5 % |
| Availability | Share of the year the plant is running. Below 100 % accounts for outages. | 100 % |
| Sun grid steps | How finely the sky is divided when calculating shade (azimuth and elevation). Smaller steps are more precise but slower. | 10°, 5° |
| Sample points per m² | Points checked for shade on each panel, between 4 and 96 per face. More points show finer shadow edges but take longer. | 0.5 |
4. Run a simulation
By panel material (recommended)
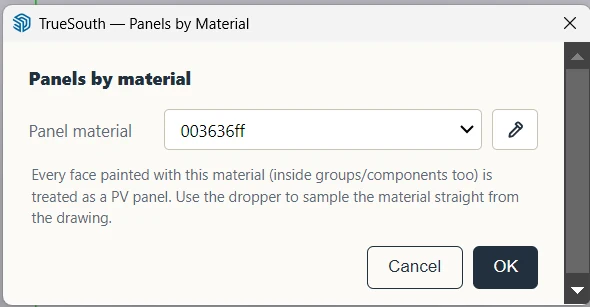
- Choose TrueSouth › Run Simulation by Panel Material….
- Pick the panel material from the list. You can also click the eyedropper and then click a panel in the model. Click OK.
- Enter the plant capacity (see below) and confirm the total.
- Wait while TrueSouth calculates shading and downloads weather data. SketchUp is busy during this step, and the status bar shows progress. The report opens when the calculation is done.
Plant capacity
TrueSouth never guesses capacity from the drawing; you state it each time. There are two ways:
- Each face = one module: enter the module wattage, for example 590 Wp. The capacity is the number of faces × wattage.
- Enter total plant kWp: use this when a face covers several modules. The capacity is shared between faces by area.
TrueSouth then shows the result, for example "52 panel faces × 590 Wp = 30.68 kWp". Check it before you continue.
On selected faces
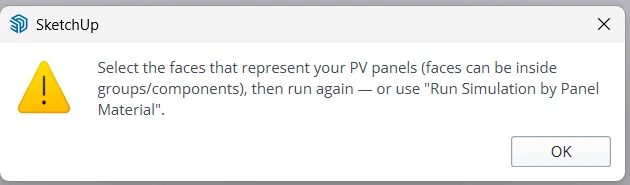
To analyse part of a plant, select the panel faces (or the groups that contain them) and choose Run Simulation on Selected Faces. If nothing usable is selected, TrueSouth tells you.
How long does it take? Small rooftops take seconds to a minute. Above 300 panel faces, TrueSouth warns you first, because the shading pass can take several minutes. For large plants, run a representative section, or lower the sample points while designing.
5. Read the report
The report opens in its own window. Print / save PDF creates a PDF for your client, and Open in browser opens the same page in your web browser. Show Last Report reopens it until you close SketchUp.
The images below come from a sample rooftop with heavy parapet shading.
Summary
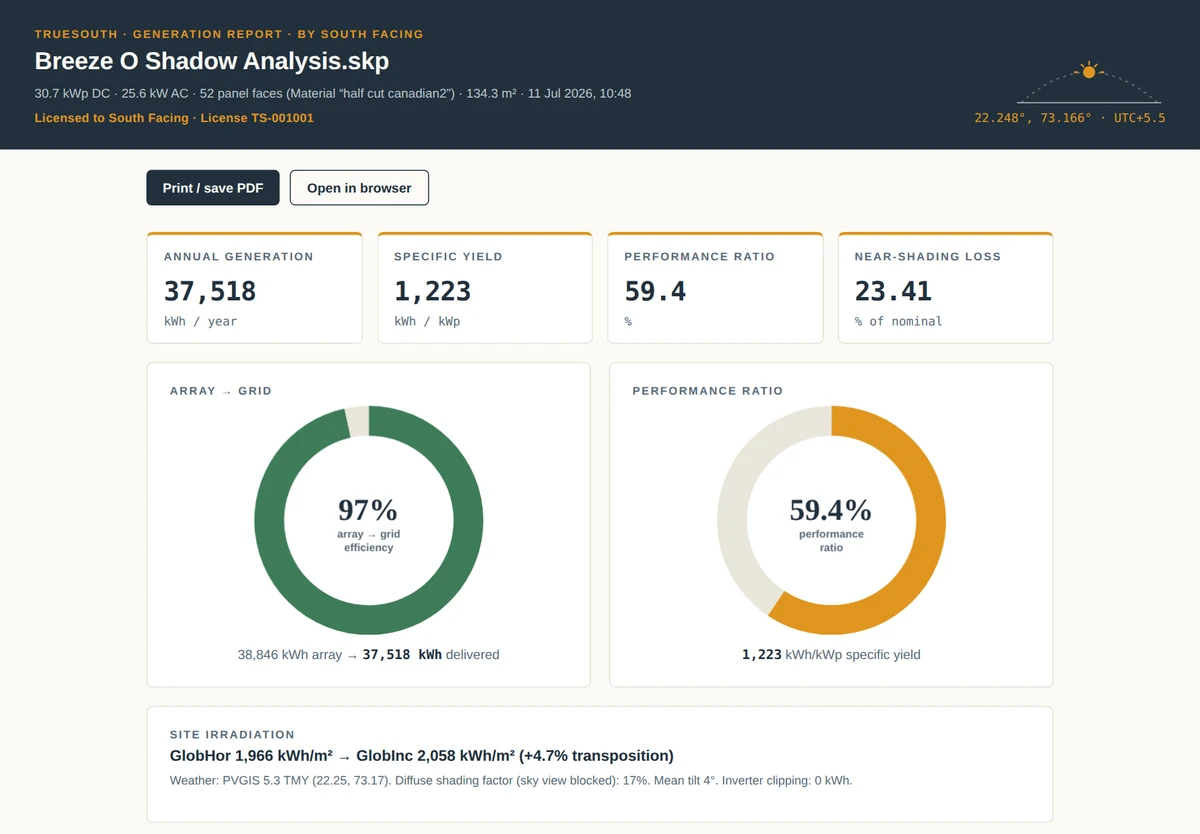
- Header: the model name, the capacity, how panels were selected, the location, and the licensed company.
- Annual generation: energy delivered to the grid in a typical year.
- Specific yield: annual generation per kWp. It is the easiest number for comparing sites and designs.
- Performance ratio (PR): delivered energy compared with the sunlight reaching the panels. Unshaded rooftops usually reach 75–82 %; a low PR points to shading or high losses.
- Near-shading loss: the share of sunlight blocked by your model's objects.
- Site irradiation: sunlight on a flat surface (GlobHor) and on the panel plane (GlobInc), plus the weather source used.
Monthly results
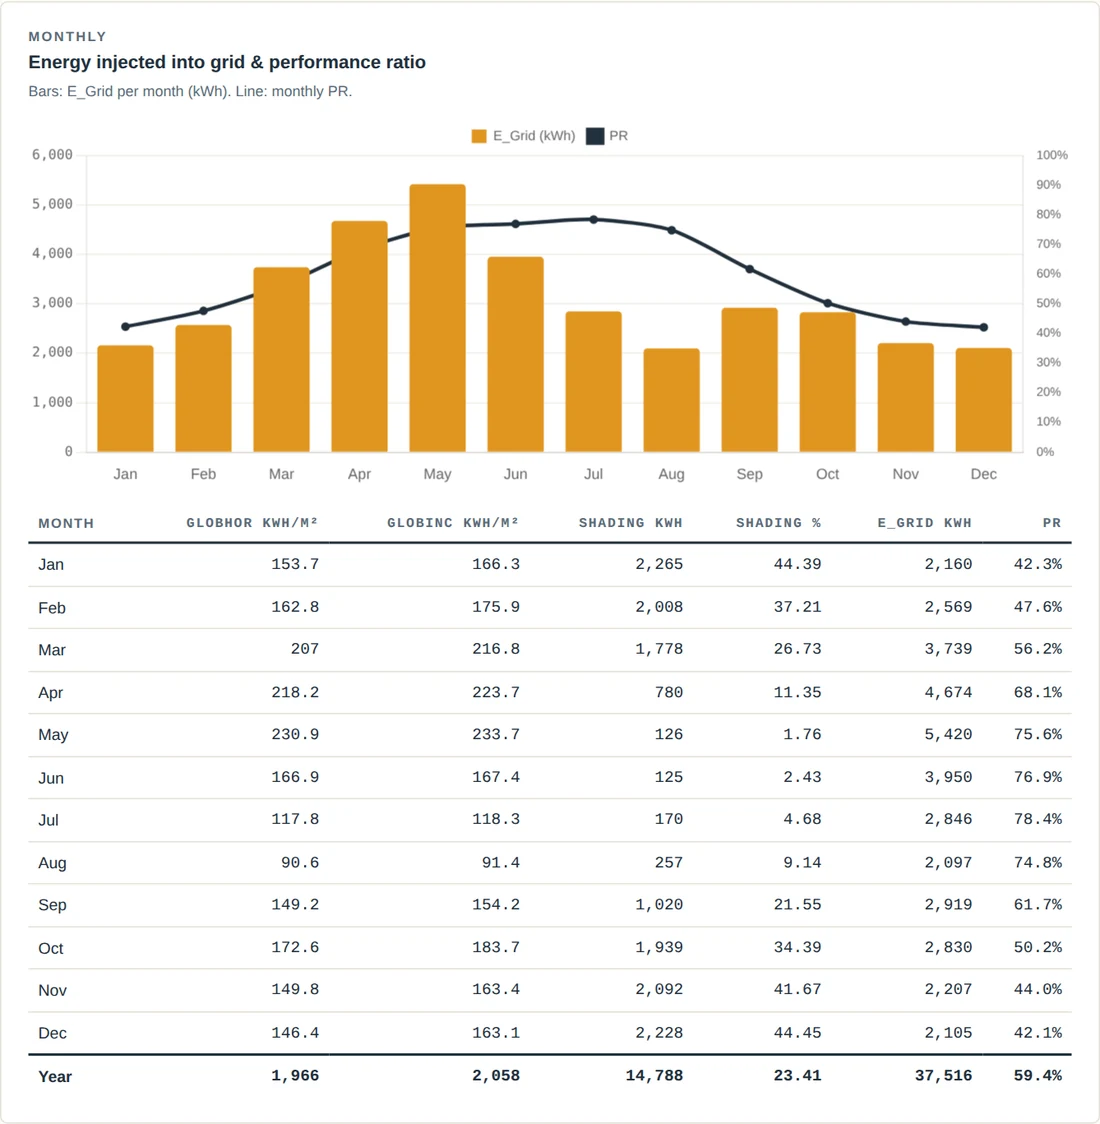
Energy per month and monthly PR, with a table of irradiation and shading. In this example, shading costs over 40 % in winter, when the sun is low and the parapets throw long shadows.
When shading happens
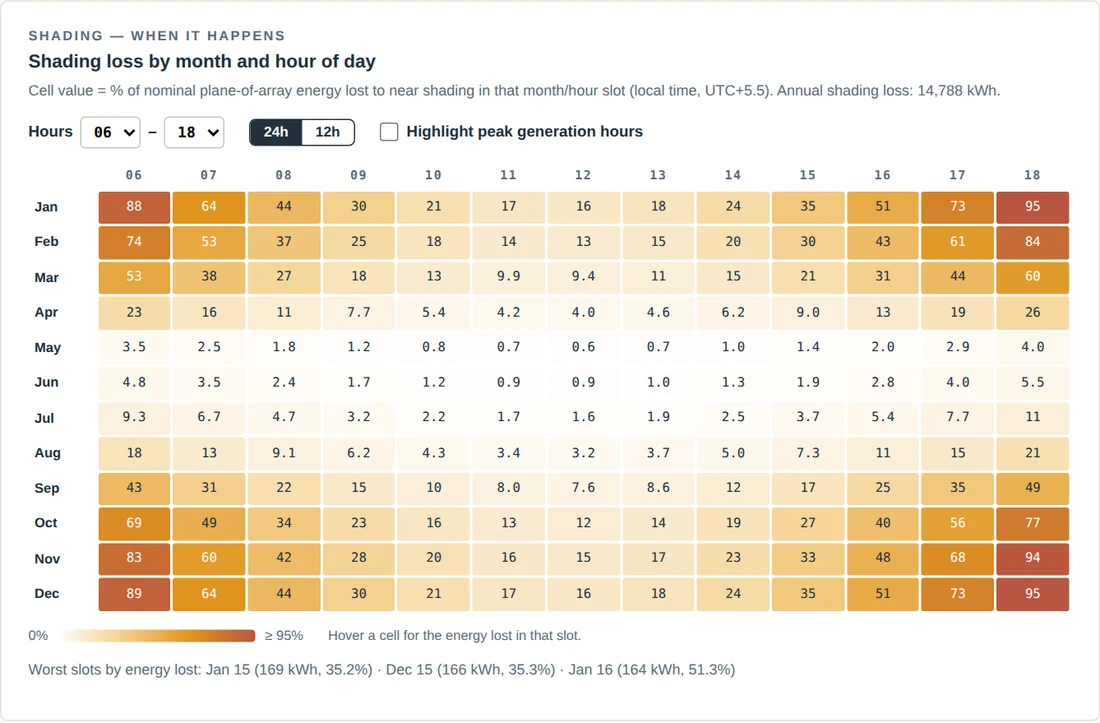
Each cell is the shading loss for one month and hour of the day, in local time. Darker cells lose more.
- Hover over a cell to see the energy lost in that slot.
- Tick Highlight peak generation hours to outline each month's three most productive hours. Shading in those slots costs the most.
- Narrow the hour range, or switch to 12-hour time, to make the chart easier to present.
Where shading happens
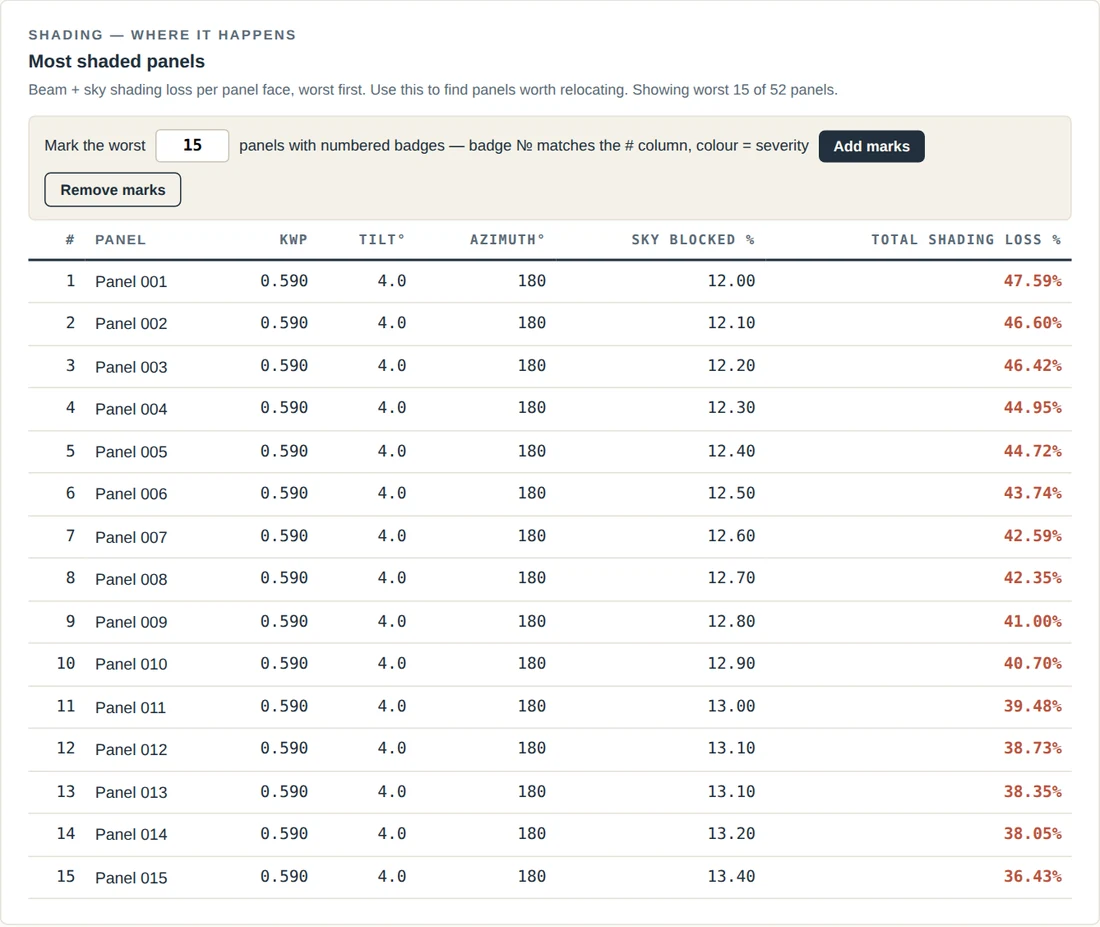
The worst panels, ranked by total shading loss. Sky blocked is the share of open sky the panel can't see. Use this list to decide which panels to move or remove, then use marks to find them in the model.
Loss diagram
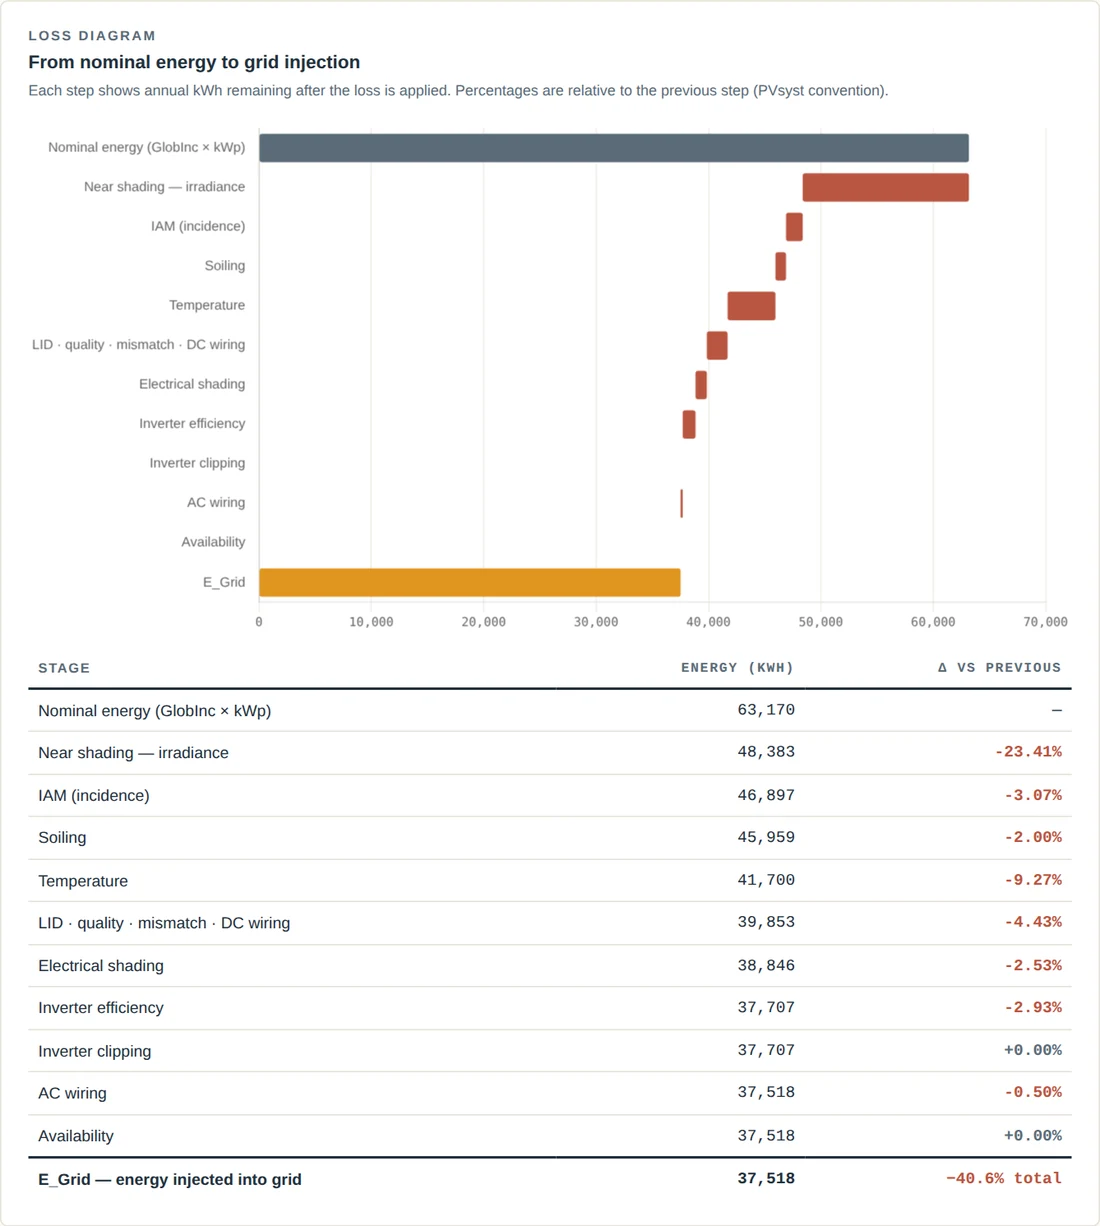
This diagram shows each step from the energy the panels could produce with all the sunlight they receive, down to the energy delivered to the grid. Each percentage is relative to the step before, the same convention PVsyst uses.
The biggest bars show where improvements pay off, for example less shading, better cooling or a different inverter size. The report ends with a list of the settings used, so the result can always be reproduced.
6. Mark shaded panels on the model
In the report's "Most shaded panels" section, enter how many panels to mark and click Add marks.
- Each marked panel gets a numbered badge that matches the # column in the table.
- Colours run from yellow to red as shading gets worse.
- The badges sit on their own tag, TrueSouth — Marks, so you can hide them, and Remove marks deletes them.
Adding or removing marks is one undo step. Marks never affect results: running the simulation again with badges in the model gives the same numbers.
7. Accuracy and limits
TrueSouth is built for early feasibility: comparing layouts, estimating generation and spotting shading problems quickly. Keep in mind:
- Only modelled shade counts. Distant hills and anything not in the model don't cast shade.
- Weather is a typical year. A real year can be several percent higher or lower.
- Results depend on your inputs. The model geometry, location, north direction, capacity and loss settings all drive the result.
- Not a bankable report. Financing and final design need a detailed energy yield assessment by a qualified professional. Every TrueSouth report says it is a feasibility estimate. Please don't present it as more than that.
For the full terms, see the License Agreement.
8. Troubleshooting
| You see | What to do |
|---|---|
| "Site location unknown" | Geo-locate the model (Window › Model Info › Geo-location), or enter latitude and longitude in Site & Weather. |
| "No faces found with material…" | The material isn't used on any face. Use the eyedropper on a panel to pick the right material. |
| Panel count or kWp looks wrong | The panel material is probably also used on other surfaces, or one face covers several modules. Use a material only for panels, or choose "Enter total plant kWp". |
| "Weather data failed" | Check your internet connection. Try again, switch to NASA POWER in Site & Weather, or use a CSV file. |
| "Could not reach the license server" | Check your internet connection. If other programs work, a firewall, antivirus or office proxy may be blocking SketchUp: allow southfacing.in, or use offline activation. |
| "This key is already active on another computer" | Click Remove from this computer on the other computer, then activate again. If that computer is not available, email us. |
| "Your computer's date or time looks wrong" | Turn on automatic date and time in Windows, connect to the internet and run again. |
| Shading chart hours look shifted | If you typed coordinates yourself, set the time zone in Site & Weather (5.5 for India). |
| SketchUp seems frozen during a run | The shading pass is still working; the status bar shows progress. Large plants can take several minutes. |
| TrueSouth menu missing after install | Check that TrueSouth is enabled in Extension Manager and restart SketchUp. It needs SketchUp 2019 or newer. |
Questions and support
Email support@southfacing.in. We reply within two business days. To help us answer quickly, include:
- your license ID (TrueSouth › License…);
- the TrueSouth and SketchUp versions (TrueSouth › About);
- a screenshot of any message.
Refunds, moving your license and your data are covered in our Refund Policy, the License Agreement and the Privacy Policy.